Using GDB with ROS2, a reference
It has been around a year since I moved to working in ROS2 full-time. Much like the Post about using GDB in ROS1, I wanted to make a reference for myself, and potentially anyone else, for creating a decent debugging workflow for ROS2. Unlike my ROS1 guide, I will be covering launch files here, as information regarding debugging with ROS2 is a bit sparse.
Step 1: Compile with debug flags
$ colcon build [flags] --cmake-args -DCMAKE_BUILD_TYPE=RelWithDebInfo
You don’t need to build your whole workspace with debug flags, just the package you want to debug. Thus, you can use packages-select to compile a single package, like so:
$ colcon build --packages-select [package_name] --cmake-args -DCMAKE_BUILD_TYPE=RelWithDebInfo
Step 2: Launch node with GDB attached
The two most common methods of launching with GDB attached are to either execute the process inside of GDB (Option 1), or to launch a gdbserver instance alongside the process, then target it in a separate terminal instance (Option 2). The latter can be useful if you’re doing remote development of some sort, and cannot spawn new sessions easily.
Case 1: Launch standalone
Option 1: Through GDB
$ gdb
(gdb) exec-file [workspace]/build/lib/[ros_package_name]/[node_name]
(gdb) start
Option 2: With ros2 launch, attaching a gdb-server to the process
$ ros2 run --prefix 'gdbserver localhost:3000' [package_name] [executable_name]
In a second terminal:
$ gdb
(gdb) target remote localhost:3000
Case 2: Configure in your launch file
GDB can be launched as part of your launch files, in the form of a launch prefix. This allows you to essentially set and forget, having the GDB session operate as part of the standard launch process. This is particularly useful if your node requires a number of parameters to be set.
Python launch file
your_node = Node(
    package='package',
    executable='executable',
    name='name',
    prefix=['gdbserver localhost:3000'],
    output='screen')
XML launch file
<launch>
  <node pkg="pkg" exec="node" name="name" launch-prefix="gdbserver localhost:3000">
  </node>
</launch>
Spawning a terminal instance
If you prefer to not use gdbserver with your launch files, you can simply substitute gdbserver localhost:3000 with xterm -e gdb -ex run --args (replace XTerm with your terminal of choice).
An addition to your ~/.bashrc to streamline your workflow.
This function, when added to your ~/.bashrc will allow you to simply type $debug_node $node_name arg1 arg2, and a GDB instance will spawn, running the target node. I use this function more than a few times a day if I’m developing a node.
debug_node()
{
    # Launch a GDB session on {node}
    # Usage: debug_node {node_name}                        "
    local full_name="$(ros2 pkg executables | grep -i $*)"
    local node_name=$(echo "$full_name" | cut -d' ' -f2)
    local pkg_name=$(echo "$full_name" | cut -d' ' -f1)
    if [ -z "$node_name" ]
    then
        echo "ERROR! Could not find node: $*, available candidates:"
        ros2 pkg executables
    else
        local pkg_dir=$(ros2 pkg prefix $pkg_name)
        gdb --args $pkg_dir/lib/$pkg_name/$node_name
    fi
}
It will also give you a list of executable options, if it fails to find the requested node.
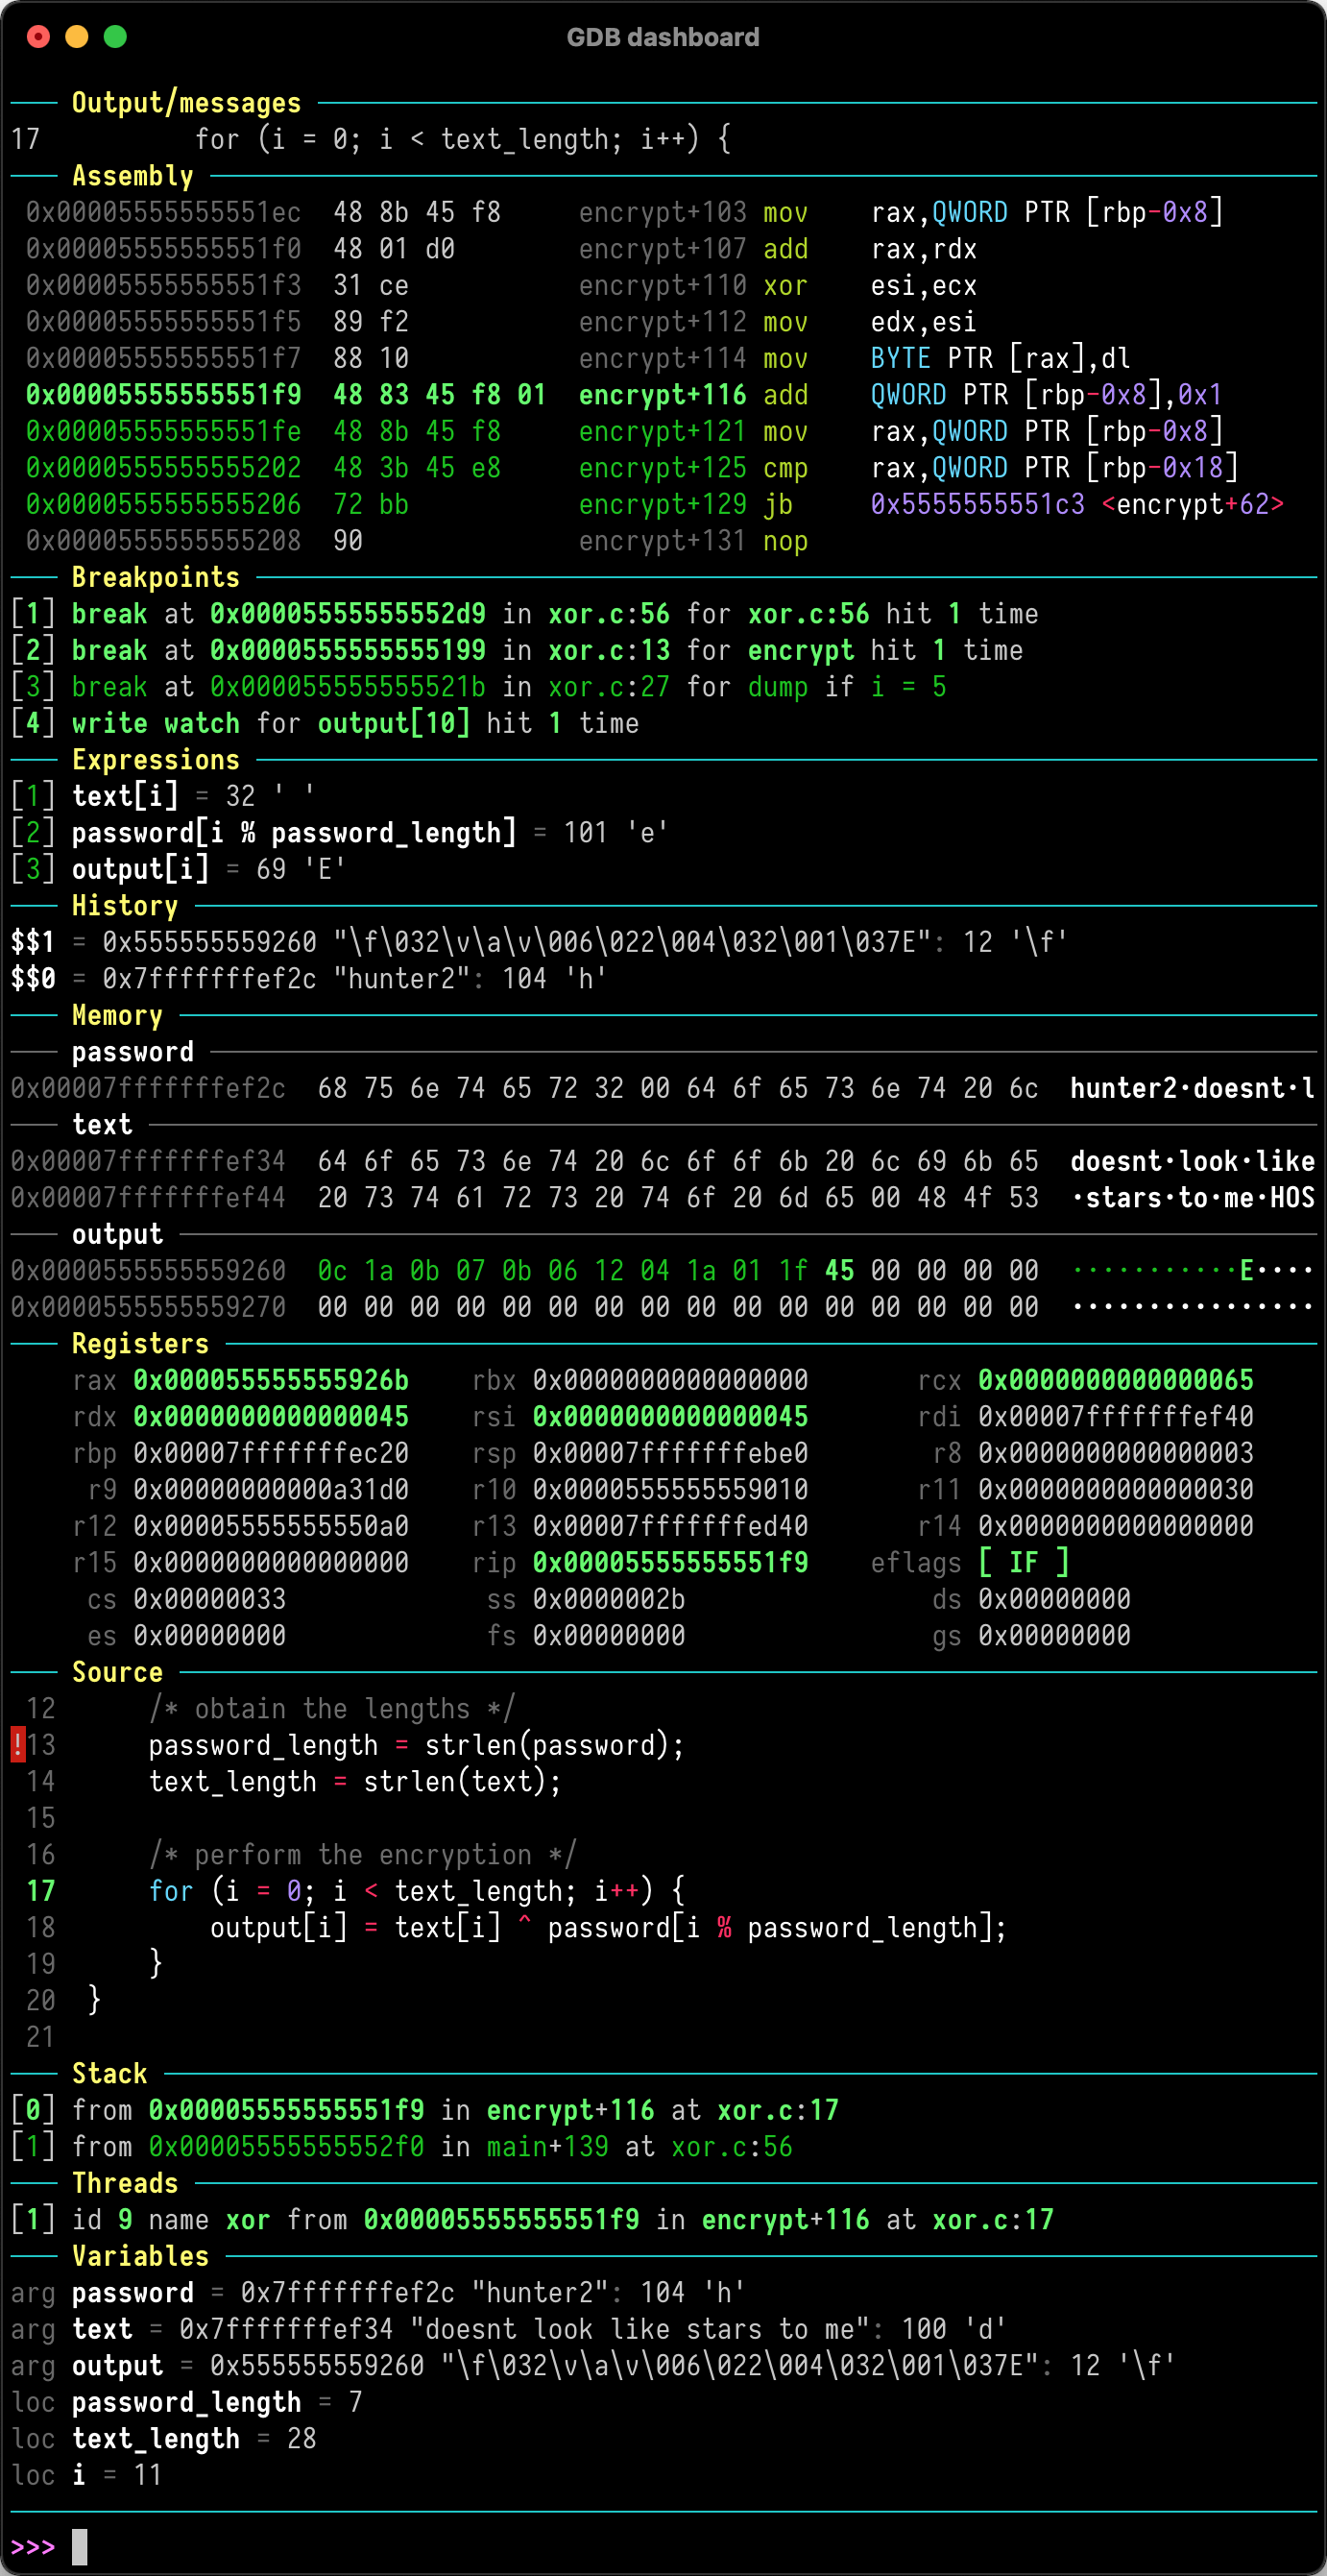
A plug for gdb-dashboard
Without question, my favourite extension to GDB is the GDB Dashboard, it will completely transform how you use GDB, and I cannot recommend it enough.
Another plug for Beej’s guide to GDB
I’ll say it again, the best introduction to GDB is Beej’s Quick Guide to GDB. Strong recommend if you’re new to using GDB.
Fin
In the future, I’d love to start playing around with using rr for debugging. I’ve heard nothing but good things about it.