Topic Plotting
TUI’s have been around for years (Understatement). There is a strong precedent for them, with plenty of examples showcasing what makes for a great piece of software. I’ve always admired how much `prettiness’ a developer can achieve using simple symbols and glyphs. I really do feel that the limitations and constraints really force one to be creative and mindful of the medium in order to get something that is enjoyable to look at.
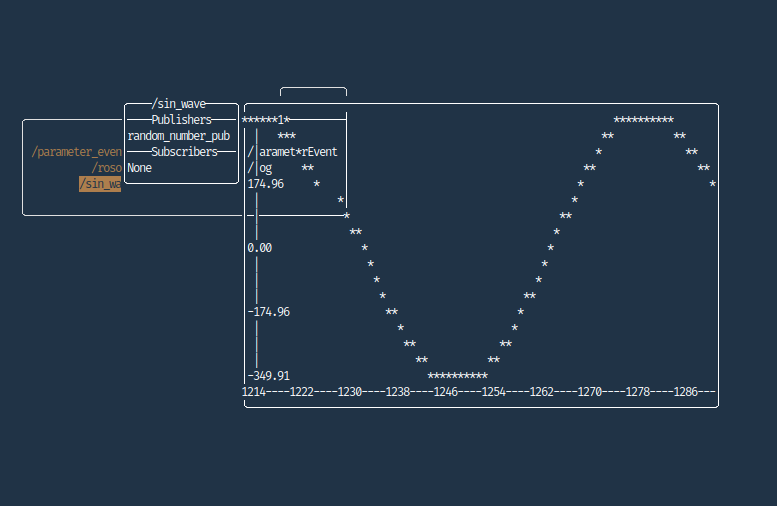
Often, things that would appear to be pretty simple actually require a great deal of thought, one of my favourite examples of this is graphing. It’s SUPER simple to get a basic graph going, just scale the points onto the screen, and place a character of your choice corresponding to the data point. That’ll get you a perfectly workable plot, which would probably look a little like this:
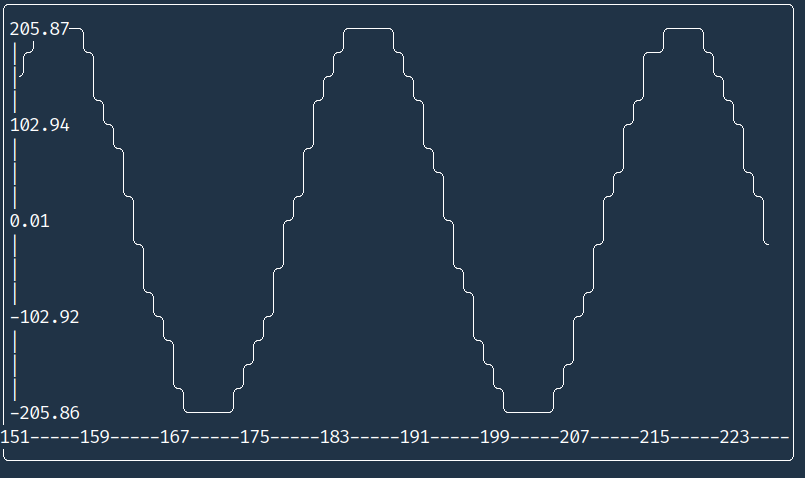
However, with a bit of work, we can refine our plot to actually be represented by a continuous line.
How do we achieve this? It’s actually surprisingly simple, looking at a section with vertical slices:

Instead of thinking about the plot in terms of points, we instead map it as a series of columns. This allows us to take advantage of a few special characters to do the following:
╮   ╭
│   │
╰   ╯
Just throw in a bit of logic for connecting the two ends, and that’s it! Here’s what it looks like in motion:
Pretty sweet. I’m kind of toying with the idea of adding grid-lines, but I’ll do that at some point in the future.